Revealbot: Facebook Ads Cost Benchmarking Tool

Challenge
Facebook stands as one of the foremost advertising channels, consistently delivering high conversion rates and billions in annual revenue. Yet despite substantial investments, performance marketers lack crucial insights into their ideal user acquisition costs and how they compare to competitors’ average CPA.
Solution
A Facebook Ads cost benchmarking tool that provides marketers with industry-standard data to understand their ad performance relative to market benchmarks, helping them make informed optimization decisions.
My Role
I spearheaded the entire journey from inception to launch - conducting user research, analyzing data, crafting the design, and orchestrating the successful launch of the benchmarking tool.
Personal Takeaways
This project taught me the critical importance of making strategic pivots based on user research. What started as a hidden premium feature became publicly accessible after learning this would better serve our trial conversion goals. I also learned that when users rely heavily on benchmarking data for business decisions, data quality and comprehensiveness become paramount - gaps we couldn’t control (like geographical data) significantly impacted user satisfaction.
SITUATION
Our sales and account management teams identified a significant problem: users were facing a lack of actionable insights from our platform. In the highly saturated marketing automation field, we needed to ensure our benchmarking feature would genuinely bring value to both current and potential users. Competitor research revealed that only Varos offered industry benchmarking data, and it was a paid service.
PROJECT GOALS
Create a tool that would help marketers understand how their ads are performing over time and whether they’re pacing with industry standards, while driving our trial user base and generating more leads.
DESIGN APPROACH
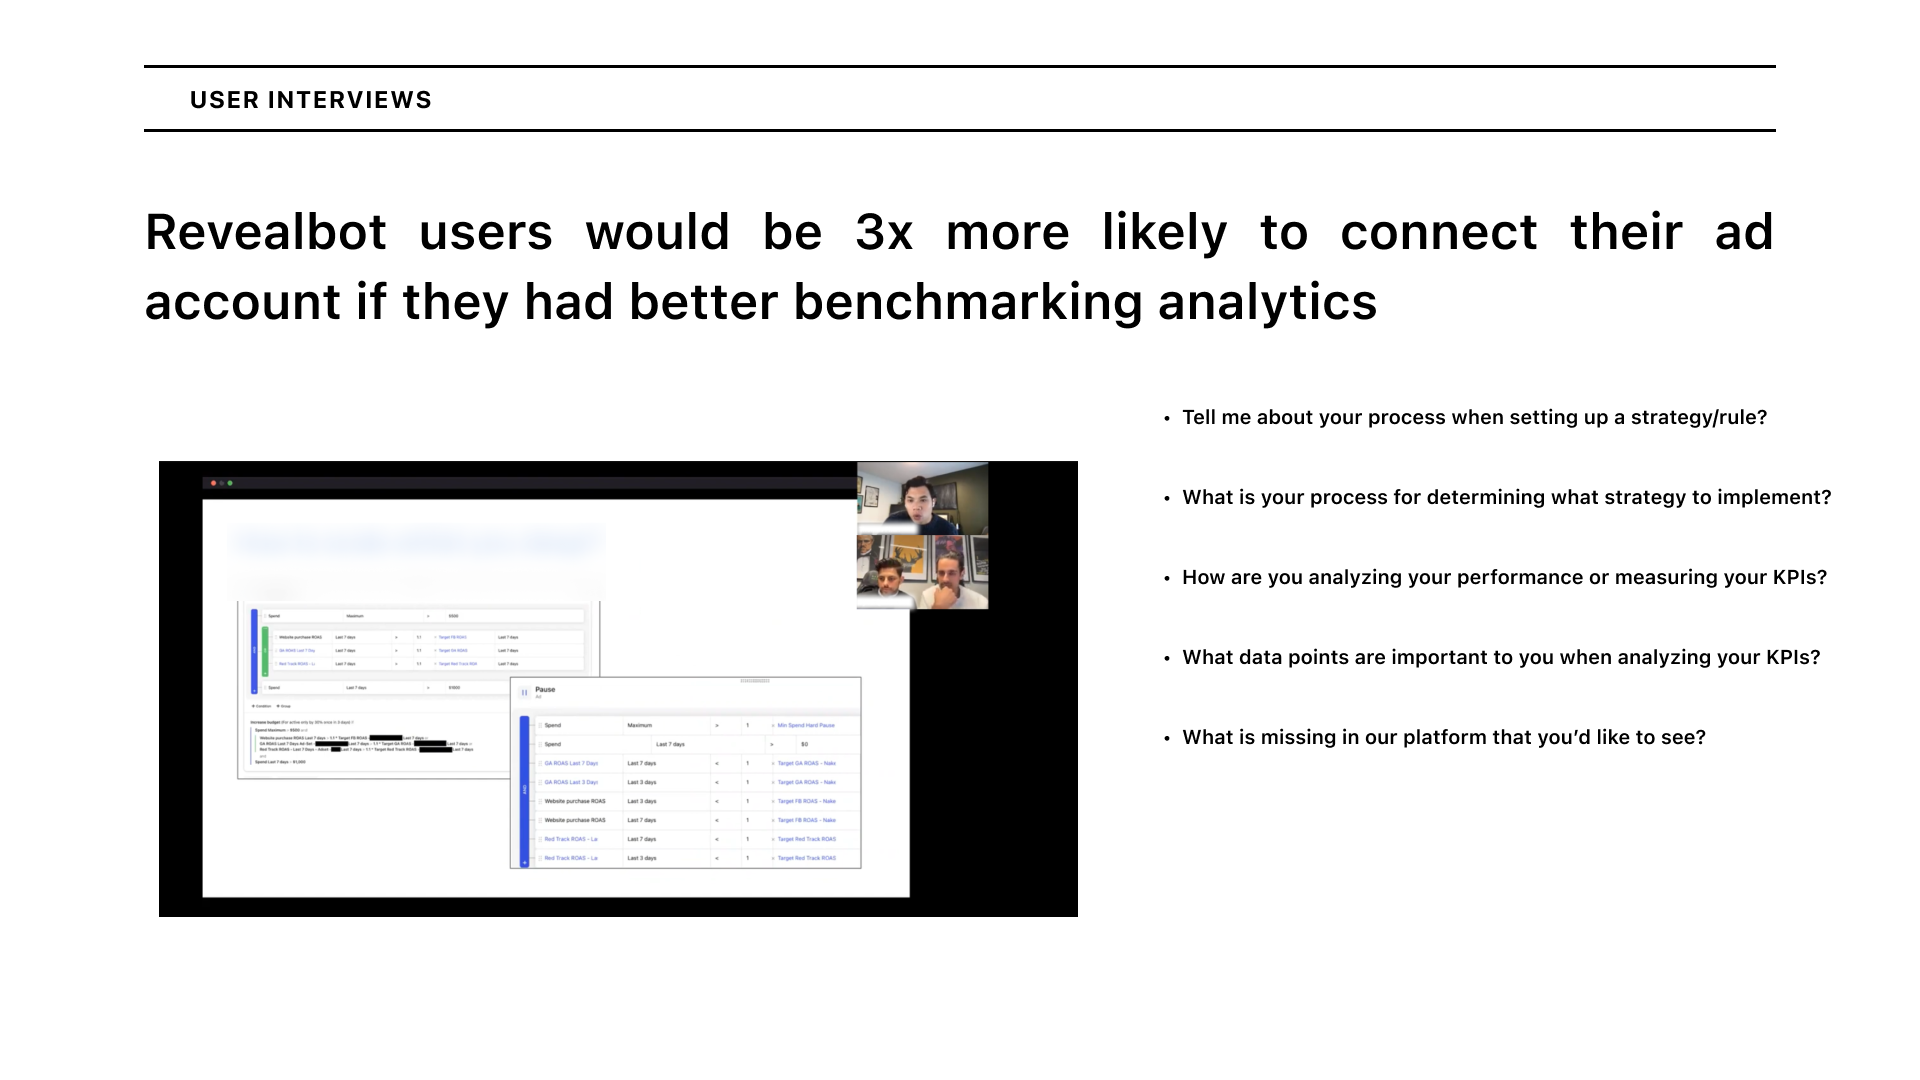
I began with deep data analysis of our existing users to uncover the root of their insights disconnect. This shaped my approach for interviewing 9 users, which yielded 100+ data points that I narrowed down to 2 main themes with 6 key insights. The research revealed a critical strategic shift: rather than hiding this feature within the app, we needed to make benchmarking data accessible to all marketers to align with our trial conversion objectives. I developed user journey maps to understand the typical onboarding experience and pain points.
PROTOTYPE + TESTING
Despite tight time constraints, I conducted rapid usability testing where users walked through their intended use of the data and analysis methods. This input provided clear direction for designing filters and simplifying the visualization of extensive data sets.
I worked closely with our PM to ensure all designs and ideas would be feasible from an engineering standpoint, particularly when planning the integration of customer data with industry benchmarks.
LAUNCH + OUTCOMES
The initial MVP launch successfully demonstrated our ability to extract and visualize backend data. While feedback was generally positive and resulted in conversions and leads, we fell short of our ambitious goals. However, a recurring theme emerged: existing users strongly desired to benchmark their own data against market data.
The tool’s design and usability received positive responses, but negative feedback centered on the absence of geographical data - a limitation beyond our control as designers that significantly impacted user satisfaction.
FINAL ITERATION
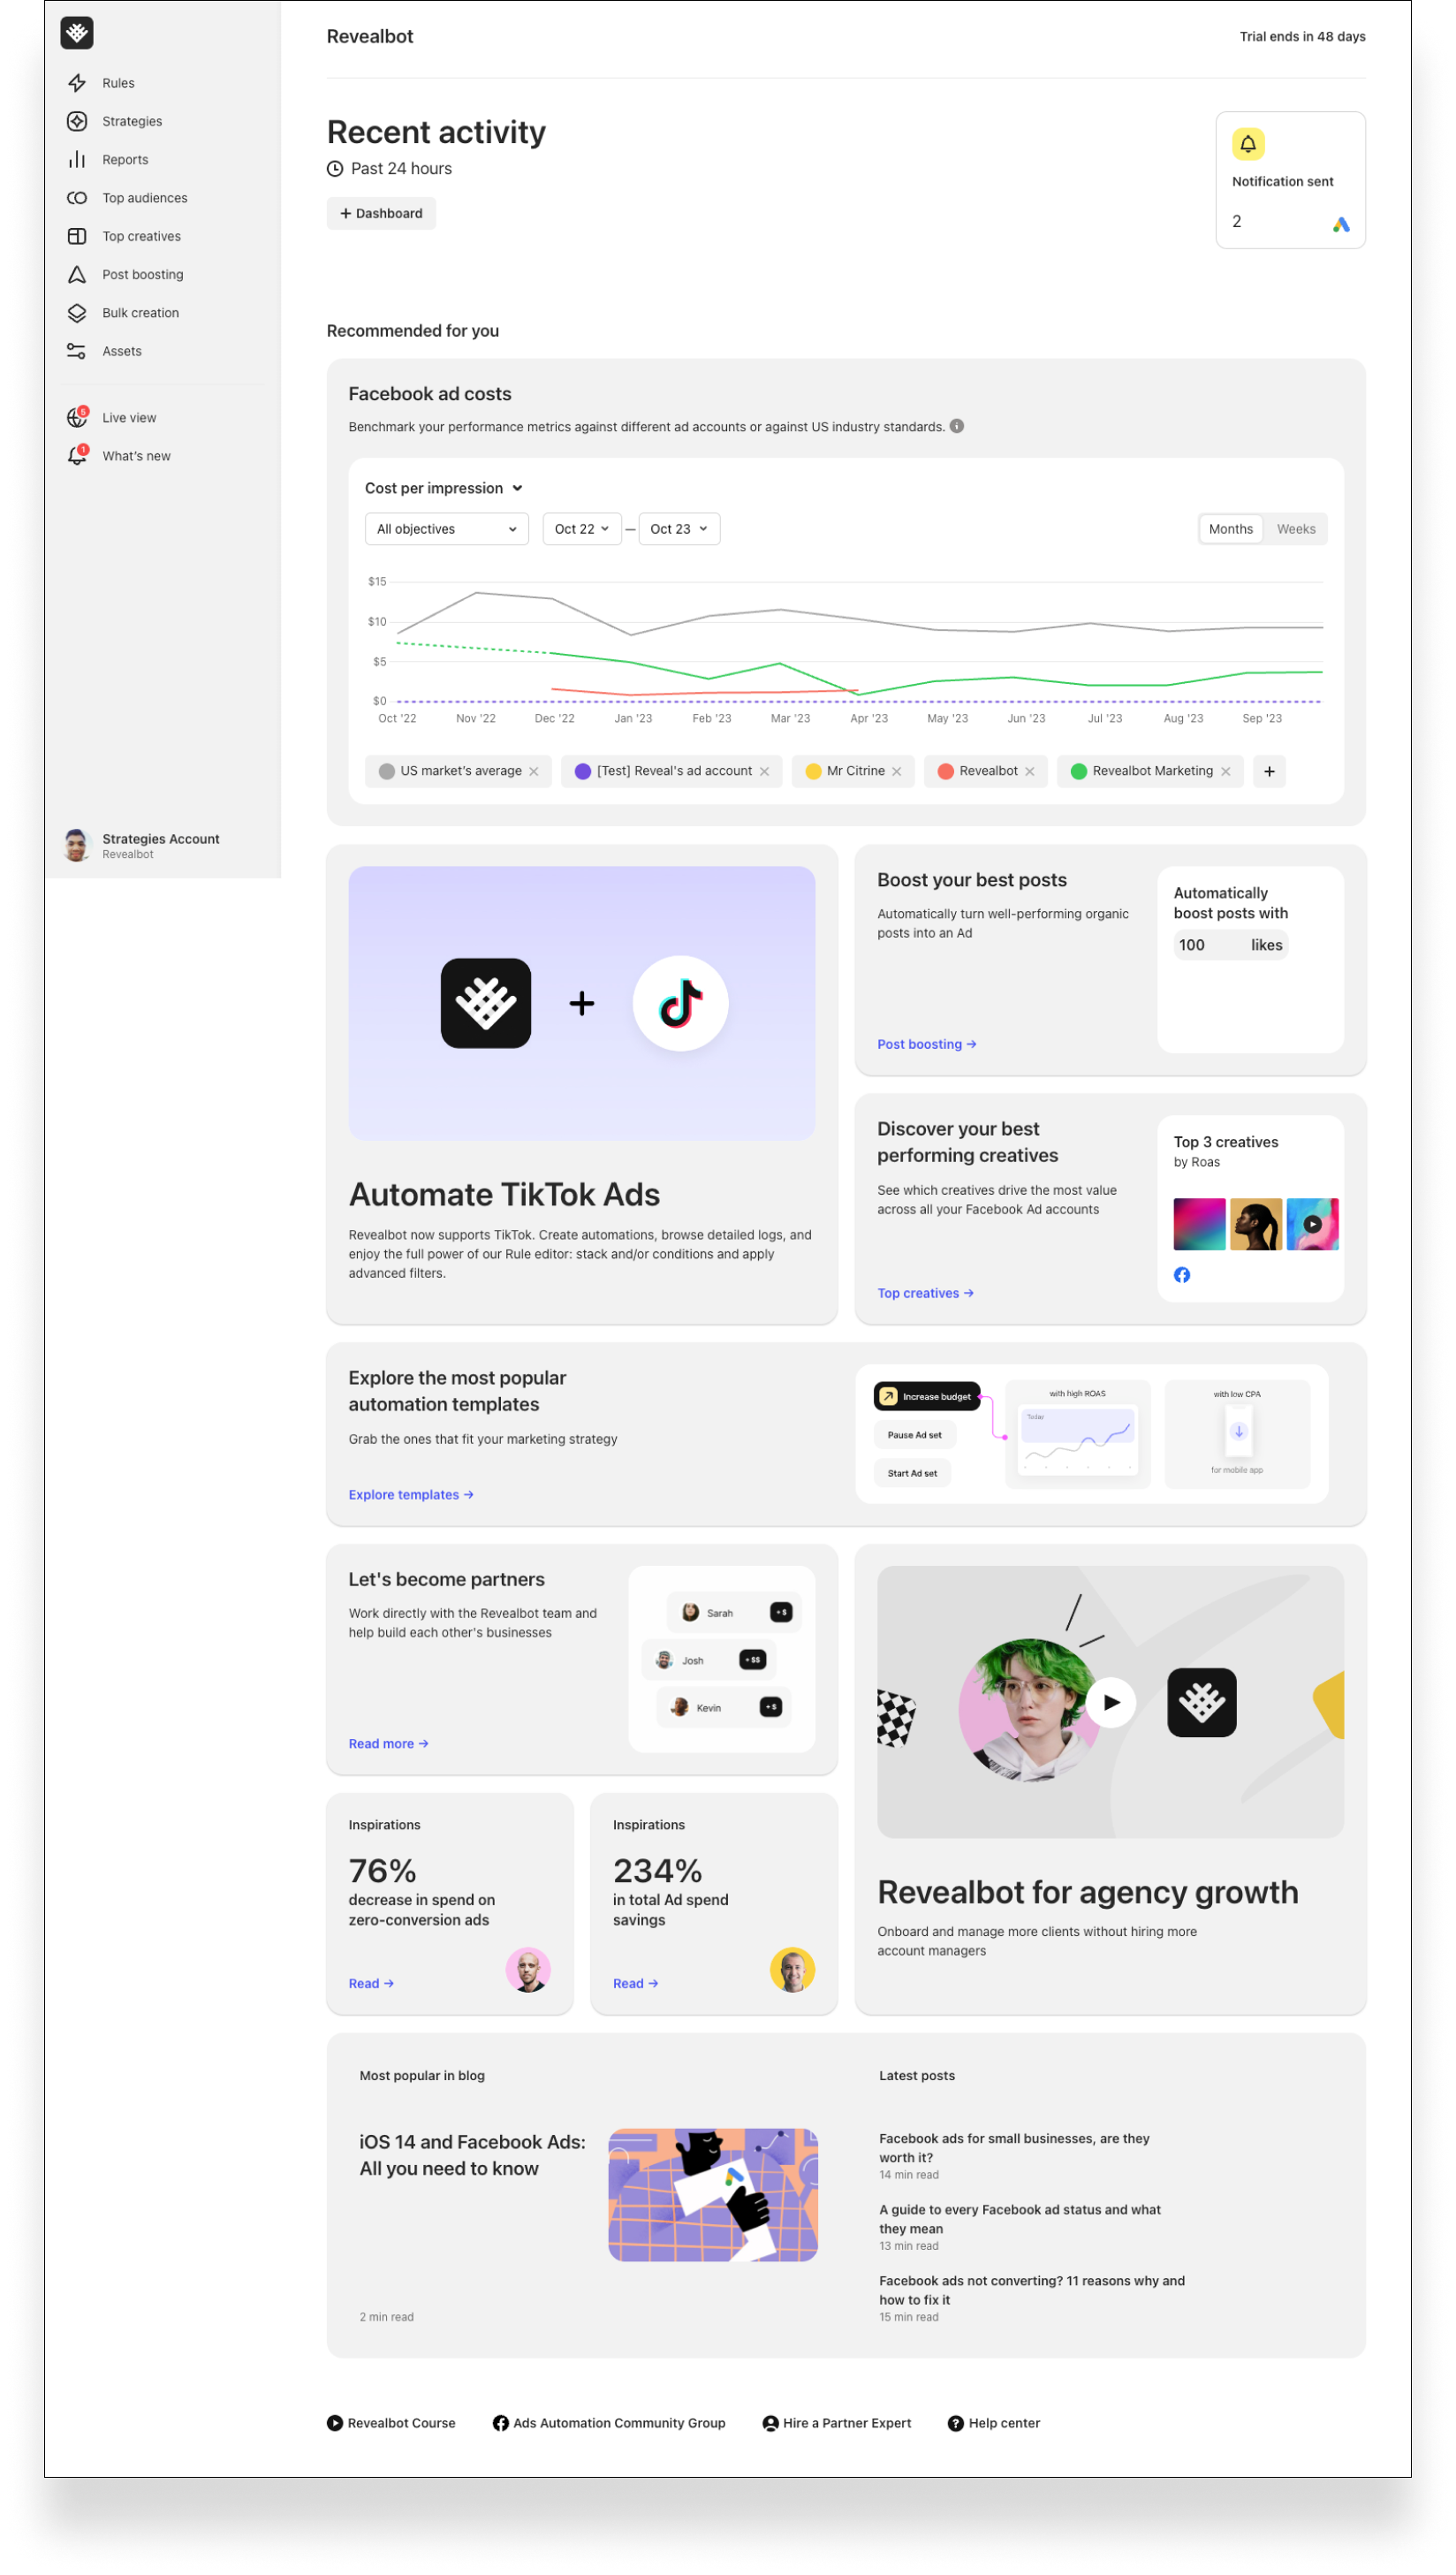
Following another round of usability testing and data collection, I worked with engineering to design a solution that integrated customer data with industry benchmarks, addressing the most common user request while balancing technical feasibility.
DETAILS
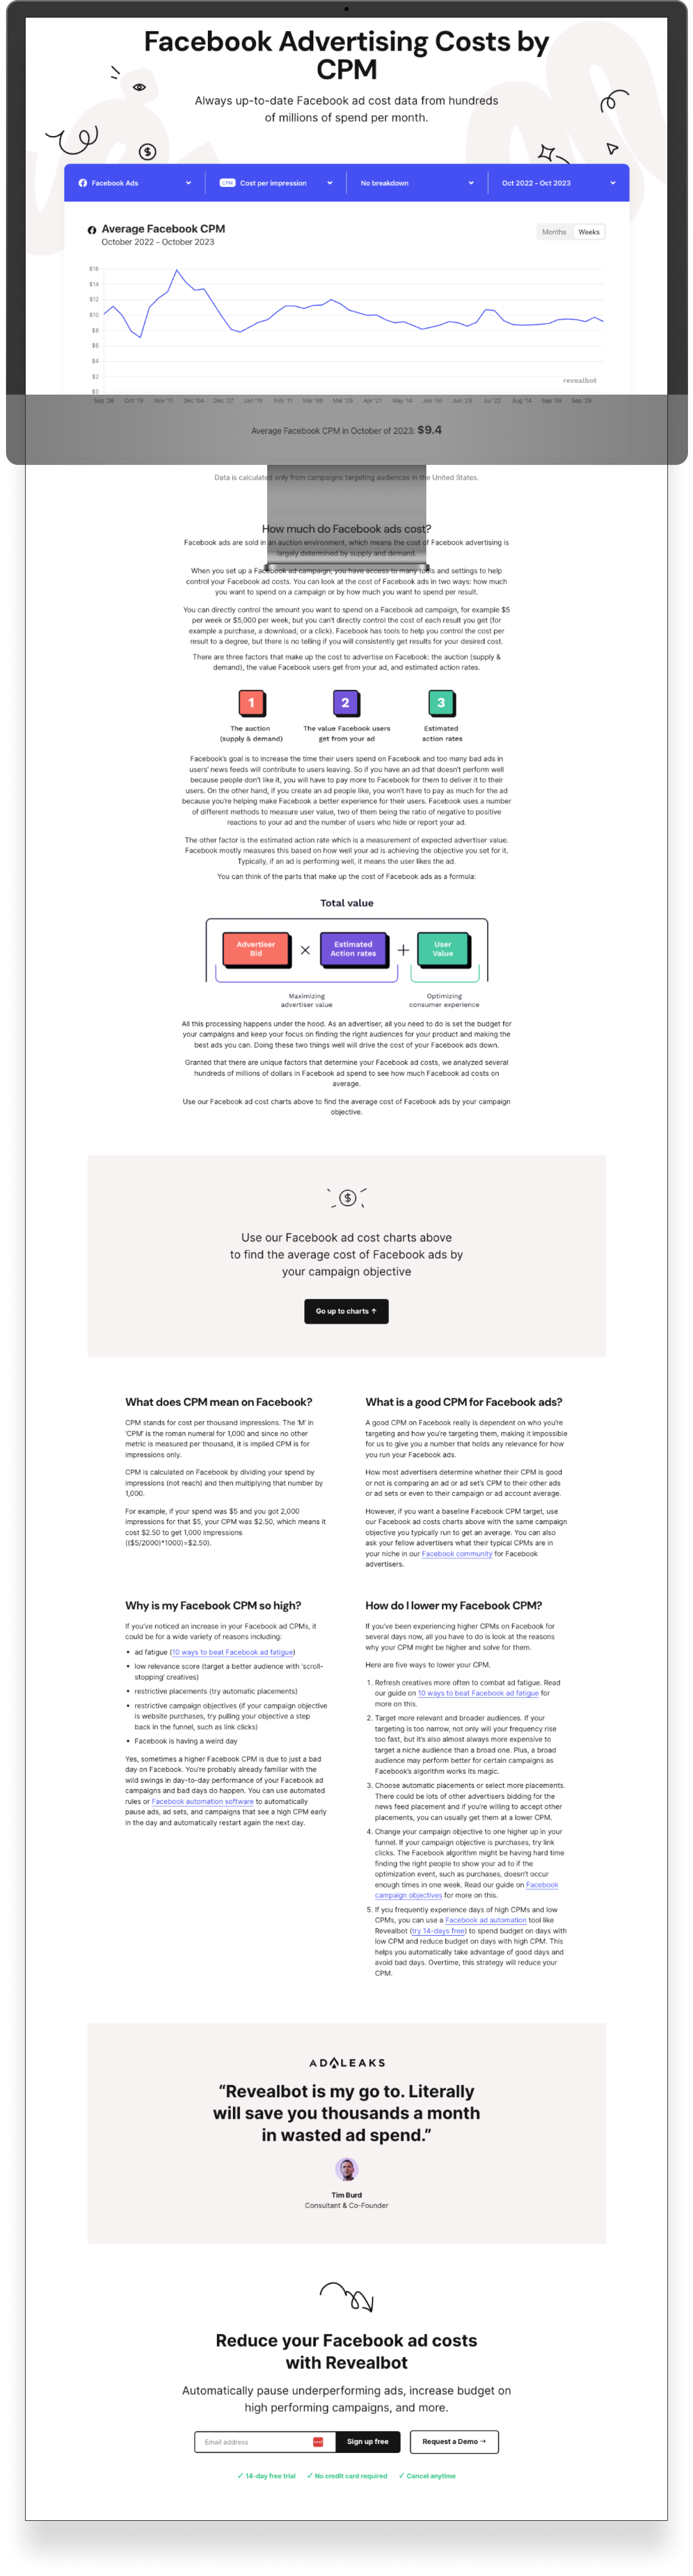
🔗 URL: Facebook Ads Cost
🗓️ DATE: March 2023
👨🏽💻 ROLE: Product Designer
🛠 TOOLS: Figma, InVision, Zeplin